Your Menu Is a Data Source
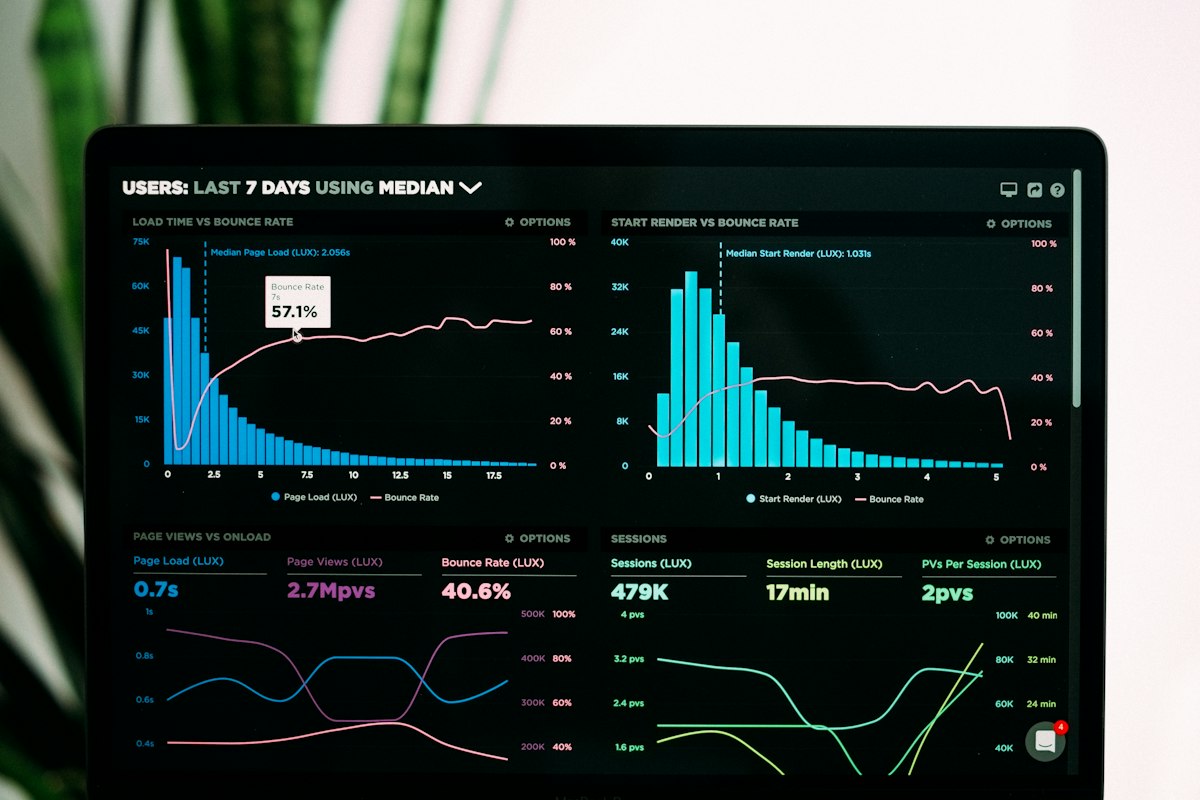
Every scan of your QR code, every product view, every category visit — these are data points that reveal exactly what your customers are interested in. QR Menu's built-in analytics dashboard surfaces this data in a clear, actionable way.
Key Metrics You Can Track
- Total menu visits — how many customers opened your menu today, this week, this month.
- Popular items — which products receive the most views.
- Category engagement — which sections of your menu attract the most attention.
- Visit trends — peak hours and busy days so you can staff appropriately.
Practical Ways to Use the Data
Promote your stars. If your analytics show that a particular dish gets lots of views but rarely ends up in a WhatsApp order, consider updating the description or photo to drive conversions.
Retire underperformers. Items that nobody views can be archived, simplifying your menu and reducing kitchen complexity.
Run time-based promotions. If visits spike on Friday evenings, schedule a happy-hour promotion to capitalise on that traffic.
Analytics Built Right In
No third-party tools or integrations needed. The analytics dashboard is available for all paid plans and updates in real time. Log in to your QR Menu dashboard and navigate to Analytics to get started.